Software notice: All programs, procedures, and files are provided on an as-is basis. Any use of these files must be in a manner consistent with U.S. law. In particular, any distribution or use for a profit-making enterprise is expressly prohibited.
Python Based Behavioral Analysis Toolbox
This toolbox provides a Python based category analysis engine modeled off of the original MS DOS CATANAL program provided by Neuroscan and our later TCL implementation of it, designed for the automated processing of behavioral data files. The functions assume that data follows the basic format utilized in Neuroscan Stim2. The program computes a number of behavioral performance metrics including error run analysis and post-trial performance. To download the xcat toolbox click here. June, 2015
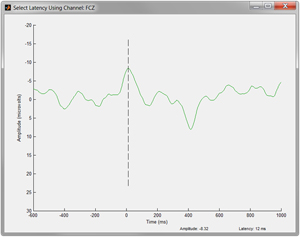
Stylized Topographic Map Plugin for EEGLAB / ERPLAB
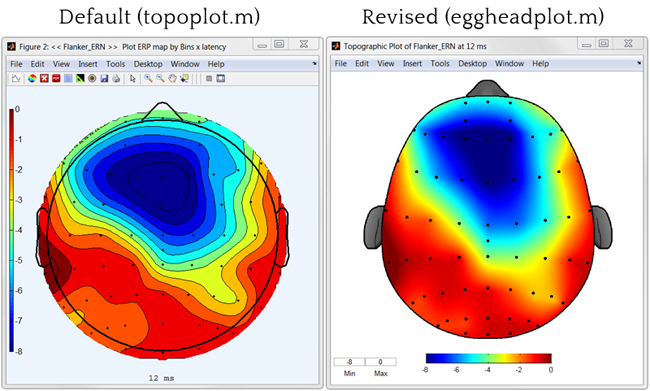
This ZIP file contains an EEGLAB / ERPLAB plugin to plot the topographic distribution of ERP data. The function uses label recognition from the 10-10 array to determine where to plot electrode activity. To install the plugin, uncompress the downloaded plug-in file in the main EEGLAB “plugins” sub-directory/sub-folder. After restarting EEGLAB, the function will be listed under the ERPLAB label of EEGLAB titled ‘Egg Head Plot’. The function allows the user to select either a known latency to plot or pick a channel to display so that the user can select the latency from the ERP trace (see image to right). To download the ZIP file click here.
Visual Inspection Plugin for EEGLAB / ERPLAB
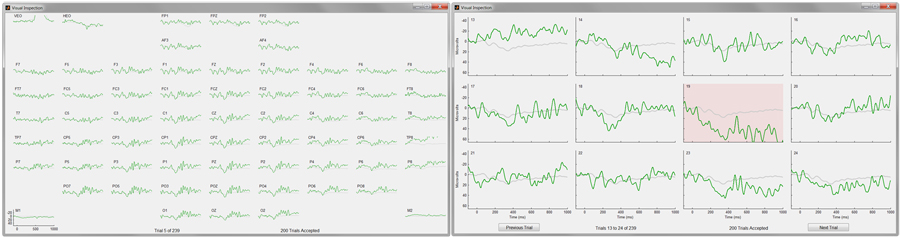
This ZIP file contains an EEGLAB / ERPLAB plugin to visually inspect EEG set data. A conventional method of inspecting EEG data by looking at activity across electrodes is available (see image on the left) to plot electrodes along in the standard 10-10 array. The user can use the right and left arrow keys to scroll through each trial, with rejected trials displayed with a red background. The user can accept or reject trials using the ‘c’ and ‘d’ keys, respectively. The EEG.reject.rejmanual array is updated with the accepted/rejected trials. Another method of inspecting the EEG data allows for plotting the mean activity at selected electrode sites across each trial (see image on the right). The user can use the arrow keys to scroll through all trials (plotted in green) with the mean ERP activity plotted in gray. The user can reject trials by clicking on the axis, turning the background red. To install the plugin, uncompress the downloaded plug-in file in the main EEGLAB “plugins” sub-directory/sub-folder. After restarting EEGLAB, the functions will be listed under the Tools label of EEGLAB titled ‘Visually Inspect EEG – Plot Array’ and ‘Visually Inspect EEG – Plot Trials’. To download the ZIP file click here.
Child Friendly Serial Nback Task

This ZIP file provides .PNG files and a .EPS file containing the Nback stimuli we have used in our pediatric serial Nback tasks. To download the stimuli files click here.
Child Friendly Fish Flanker Task

This ZIP file provides .JPG files and a .EPS file containing the Fish Flanker stimuli we have used in our pediatric flanker tasks. We have successfully utilized this task in both ERP (Pontifex, Saliba, Raine, Picchietti, & Hillman, 2012) and MRI (Voss et al., 2011) environments and have observed that children as young as 4 years can successfully complete the flanker task using these stimuli. To download the stimuli files click here.
Child Friendly color-shape switch task


This ZIP file provides .JPG files and a .EPS file containing the Color-Shape stimuli we have used in our pediatric Switch tasks (Pontifex et al., 2013) which are based off of Espy (1997). To download the stimuli files click here.
Child Friendly GO/NOGO Task


This ZIP file provides .JPG files of the child friendly stimuli we have used in our pediatric Go/Nogo tasks (Hillman et al., 2012; Kamijo et al., 2012). To download the stimuli files click here.
Revised Neuroscan 2D Map Topographic Template

This MAP file provides a high-resolution fix to the default 2D topographic MAP template in SCAN 4.5 (and previous versions) and provides better support for the 10-10 electrode array. To download the map file click here.
Revised Neuroscan Catanal Procedure
This TCL procedure replaces the original Neuroscan CATANAL program in reducing STIM2 (and STIM1) behavioral data files. Since we took the time to write a new program, we also threw in some things that we wished the old CATANAL program did. Specifically, this new program XCATANAL calculates both mean and median RT as well as SD and coefficient of variation for RT. For response accuracy, this procedure computes mean accuracy (percent correct), the total number of errors and the distribution of those errors across commission and omission errors. Lastly, this program calculates “inverse efficiency” (mean RT for a particular condition divided by the proportion of correct responses for that condition) which is a measure of performance that provides some correction for speed/accuracy tradeoffs (Townsend & Ashby, 1983). The program also provides optional parameters for conducting error run analysis and obtaining post trial performance. We have also just recently added functionality to translate E-Prime .TXT output files into a format compatible with the XCATANAL procedures. To download the XCATNAL TCL procedure click here.