Date Program Tables are updated: 10/1/24
Program Disclosures
Does the program or institution require students, trainees, and/or staff (faculty) to comply with specific policies or practices related to the institution’s affiliation or purpose? Such policies or practices may include, but are not limited to, admissions, hiring, retention policies, and/or requirements for completion that express mission and values? Yes or No
Time to completion for all students entering the program
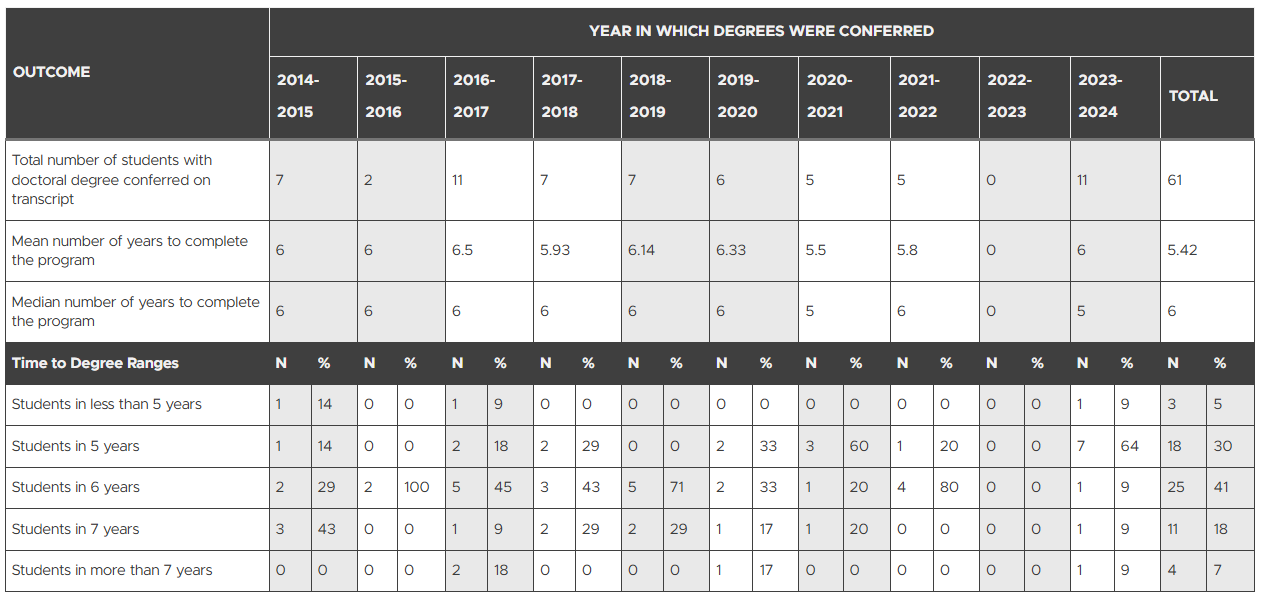
Please see pp. 8-9 of the 2023-2024 Ph.D. Program Handbook for program admissions policies that allow students to enter with credit for prior graduate work.
Program Costs (Tuition and Fees)
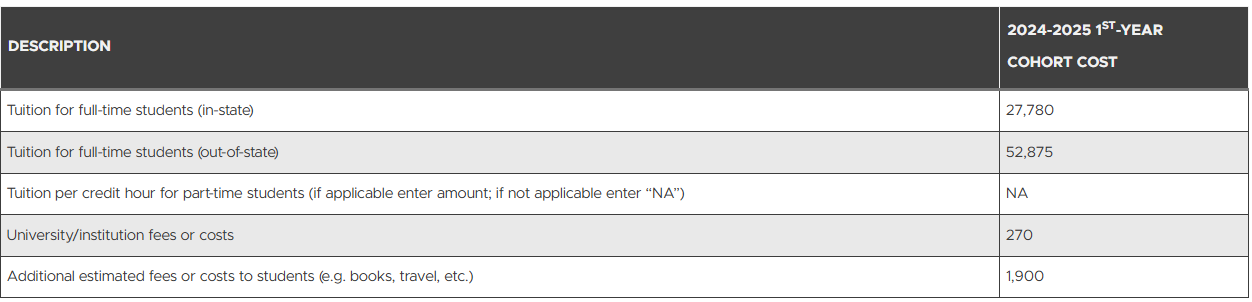
Students admitted to the Ph.D. program often receive graduate assistantships that cover tuition costs. Actual costs for students who receive assistantships are lower than indicated in this table.
Internship Placement Table 1
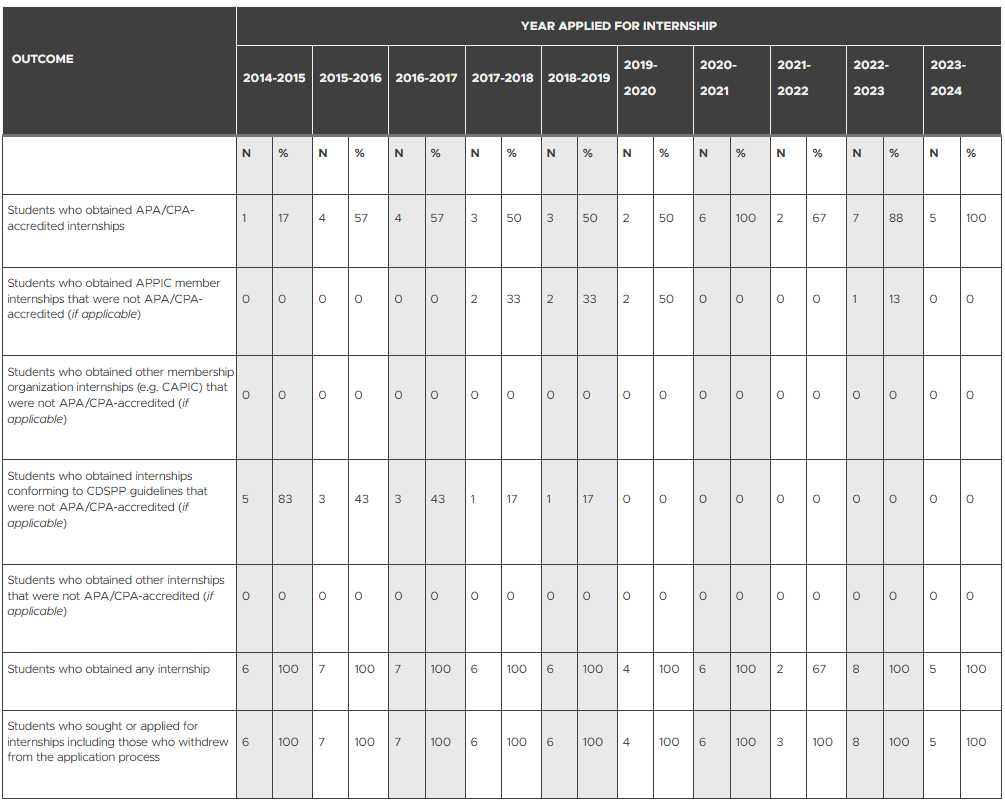
Internship Placement Table 2

Attrition

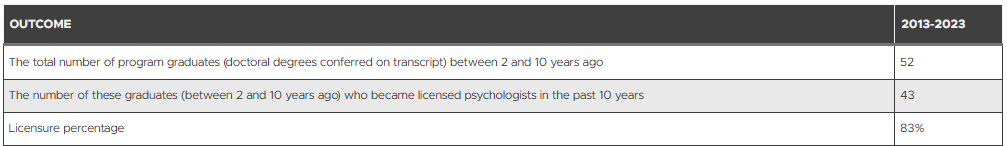
Licensure